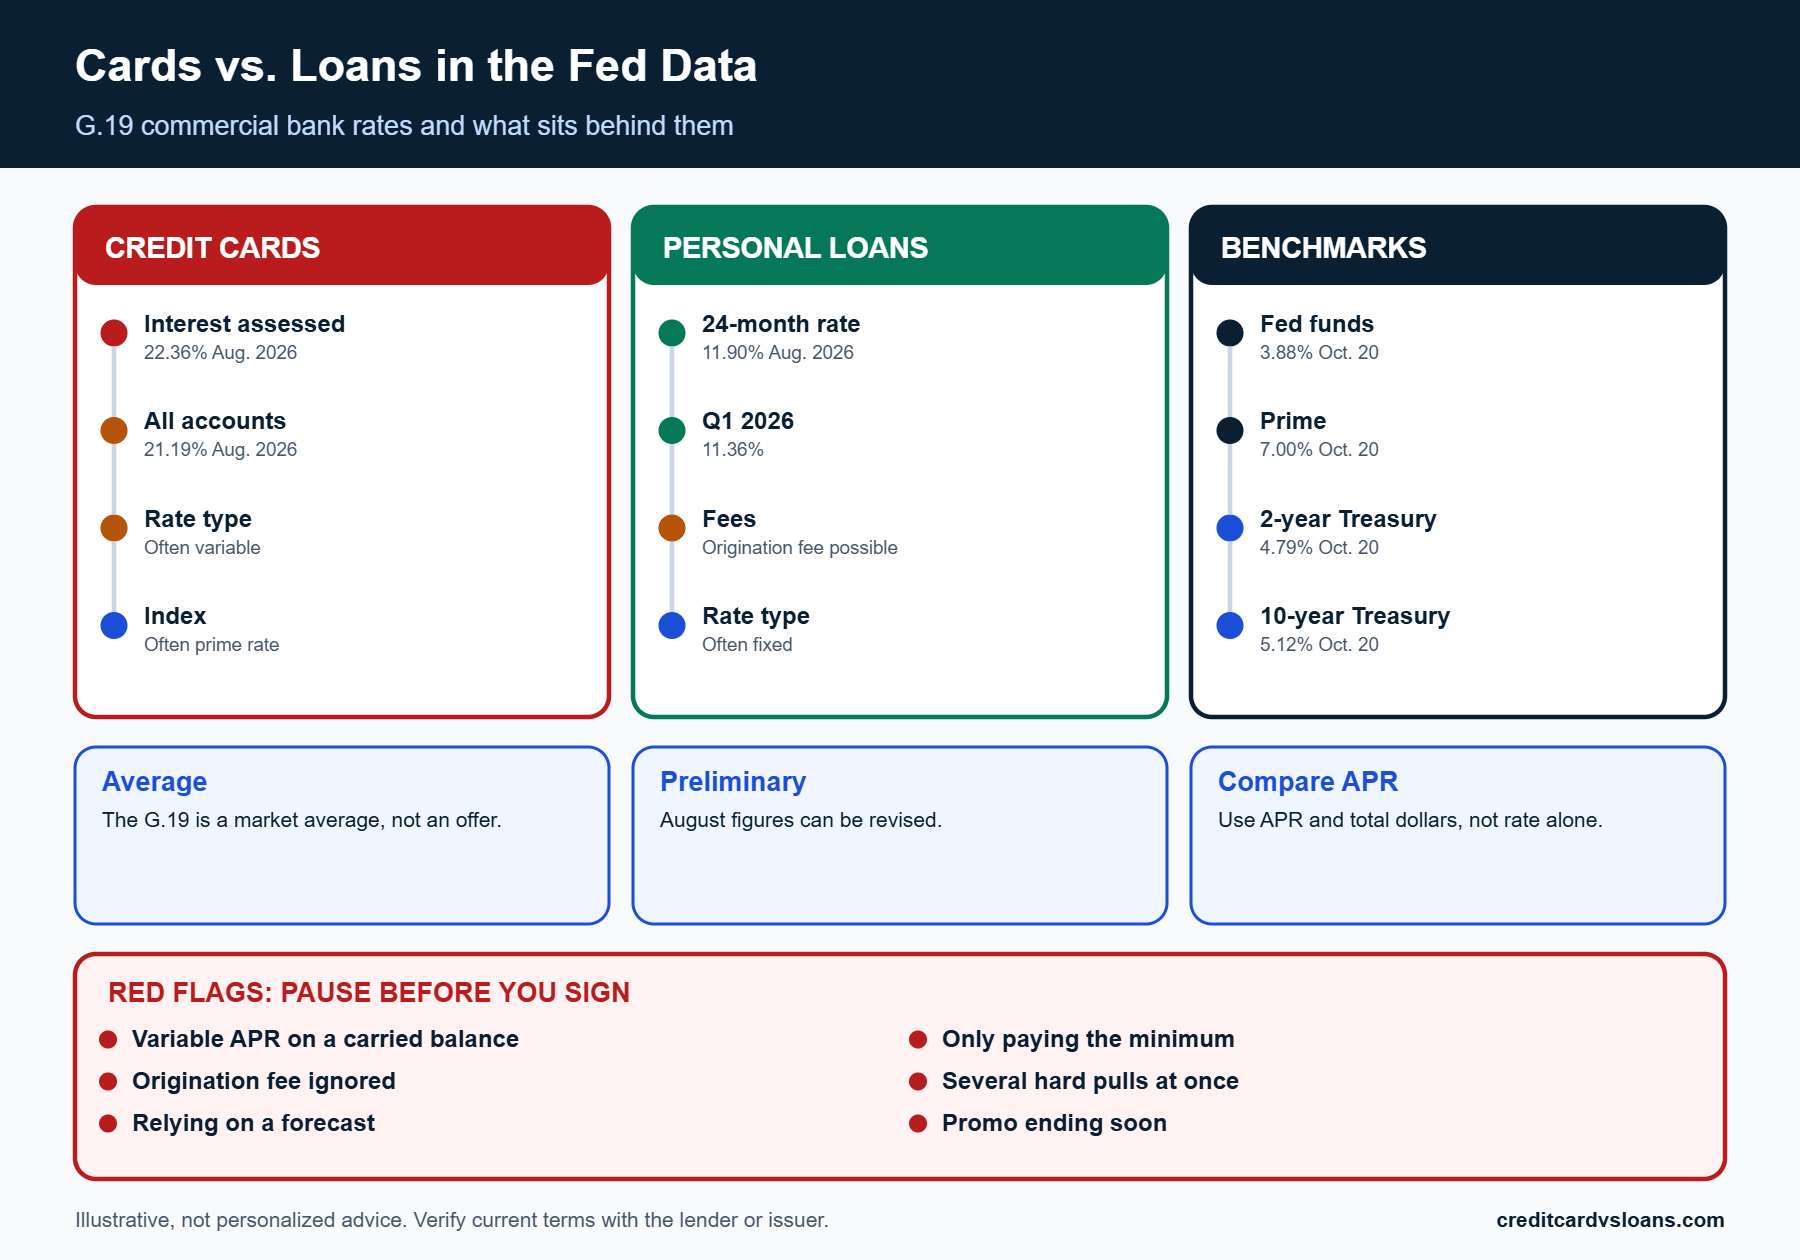
Credit card and personal loan rates October 2026 are higher than they were at the start of the year, and the latest Federal Reserve data points to a card market that is still far more expensive than the personal loan market. In the Fed’s G.19 release of October 7, 2026, the average rate on credit card accounts assessed interest at commercial banks was 22.36% in August (preliminary), against 11.90% for 24-month personal loans. The Federal Open Market Committee raised its target range by a quarter point on September 16, and its next meeting is October 27 to 28.
This monthly brief pulls together the newest figures from three Federal Reserve sources: the G.19 consumer credit release, the H.15 selected interest rates release, and the September FOMC statement. It states the date on every number, says plainly which data is the latest available, and avoids guessing what has not been published yet. It also explains what the numbers can and cannot tell you about the offer sitting in front of you.
This is the October edition of a monthly series. For the previous edition, see the September 2026 rate outlook. Nothing here predicts where rates are headed, and nothing here is personalized advice.
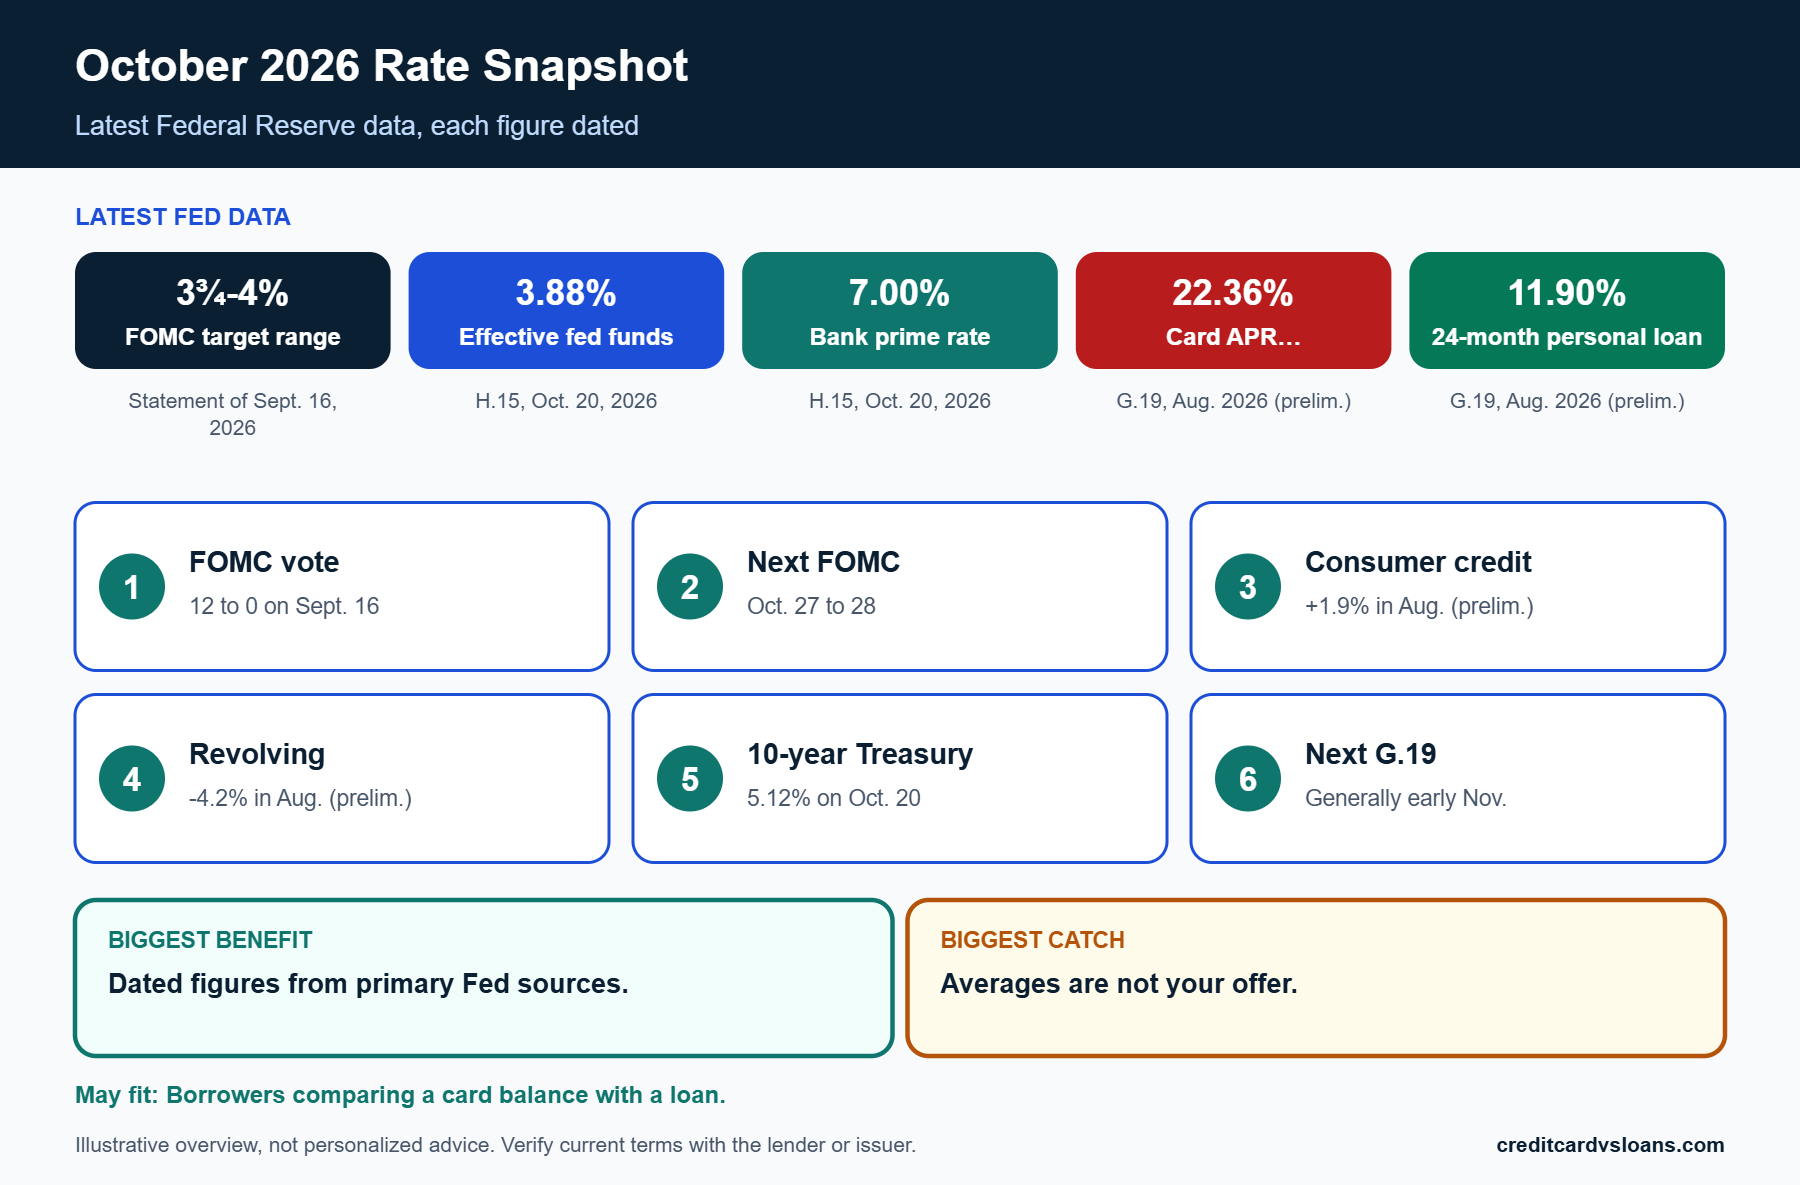
- The FOMC raised the federal funds target range by one quarter percentage point, to 3¾% to 4%, in a unanimous 12 to 0 vote on September 16, 2026.
- As of the H.15 release of October 21, 2026 (values for October 20), the effective federal funds rate was 3.88% and the bank prime loan rate was 7.00%.
- G.19 (October 7, 2026): commercial bank interest on accounts assessed interest was 22.36% in August 2026 (preliminary) versus 22.15% in the second quarter and 21.52% in the first. The 24-month personal loan rate was 11.90% in August (preliminary).
- Consumer credit rose at a 1.9% seasonally adjusted annual rate in August (preliminary), with revolving credit down 4.2% and nonrevolving credit up 4.1%.
- The September G.19 and the October FOMC decision have not been released as of October 22, 2026. Watch for them rather than assuming the outcome.
Data in this brief is current as of October 22, 2026. G.19 figures come from the October 7, 2026 release; H.15 figures are daily values through October 20, 2026, published October 21; the FOMC figures come from the statement released at 2:00 p.m. on September 16, 2026. Values marked preliminary can be revised in later releases.
Table of contents
The October 2026 snapshot: Fed policy and benchmark rates
What the FOMC did in September
The decision and the vote
The Federal Open Market Committee’s statement of September 16, 2026, issued after the September 15 to 16 meeting, announced an increase of one quarter percentage point in the federal funds target range, to 3¾% to 4%. The vote was 12 to 0. The September meeting is one of the four in 2026 that includes a Summary of Economic Projections, according to the Fed’s meeting calendar.
Because the move was a quarter-point increase, the prior range was 3½% to 3¾%. The target range is the Fed’s policy setting for the overnight rate at which banks lend to each other, and it influences, rather than directly sets, the rates you see on cards and loans.
What the statement said about the economy
The statement said inflation remains elevated, and it described the policy action as supporting a timelier return to the Committee’s 2% goal. It also said job gains have kept pace with the workforce and that the unemployment rate has changed little. We describe those points in plain terms rather than quote the statement at length. If you want the exact language and the full list of voting members, read the statement on the Federal Reserve’s website.
Where benchmark rates stood on October 20
Fed funds and the prime rate
The H.15 release dated October 21, 2026 shows daily values through October 20. The effective federal funds rate, the rate banks actually paid on overnight borrowing, was 3.88% each day from October 14 through October 20. The bank prime loan rate was 7.00% on each of those days. On those dates the prime rate sat 3 percentage points above the top of the 3¾% to 4% target range, and prime is an index many variable-rate consumer products reference.
Many credit card APRs are variable. The Consumer Financial Protection Bureau notes that a variable introductory rate tied to an index such as the prime rate can change during the first six months when that index moves. Your own agreement shows which index applies and the margin the issuer adds.
Treasury yields on the same date
The same release shows the 1-year Treasury constant maturity yield at 4.51%, the 2-year at 4.79% and the 10-year at 5.12% on October 20. Treasury yields are market rates set by investors and are not tied one-for-one to the federal funds rate. They matter for borrowers mostly as background, because fixed-rate loan pricing often reflects the cost of longer-term funding. Do not read them as a forecast of what your lender will charge.
| Measure | Latest value | Date and source |
|---|---|---|
| FOMC target range | 3¾% to 4% | Statement of September 16, 2026 |
| Effective federal funds rate | 3.88% | H.15, October 20, 2026 (released Oct. 21) |
| Bank prime loan rate | 7.00% | H.15, October 20, 2026 |
| 1-year / 2-year / 10-year Treasury | 4.51% / 4.79% / 5.12% | H.15, October 20, 2026 |
| Card rate, accounts assessed interest | 22.36% (prelim.) | G.19, Aug. 2026, released Oct. 7 |
| 24-month personal loan rate | 11.90% (prelim.) | G.19, Aug. 2026, released Oct. 7 |
What the G.19 shows about consumer borrowing
Growth in consumer credit
August 2026 (preliminary)
The Federal Reserve’s G.19 release of October 7, 2026 reports that consumer credit increased at a seasonally adjusted annual rate of 1.9% in August. Revolving credit, which mostly means credit cards, decreased at an annual rate of 4.2%. Nonrevolving credit, which includes most auto and student loans, increased at an annual rate of 4.1%. The seasonally adjusted level of total consumer credit was $5,196.8 billion, of which $1,352.4 billion was revolving and $3,844.4 billion nonrevolving.
A monthly change annualizes a single month’s movement, so one soft month for cards does not by itself indicate a trend. It does show that card balances did not grow at the pace seen in the prior months.
The quarterly and monthly trail
The release shows total consumer credit growing at 2.6% in the first quarter and 3.1% in the second, with revolving credit growing at 4.2% and 4.9%, and nonrevolving at 2.0% and 2.4%. In the monthly figures, total credit grew 3.6% in June and 4.1% in July before the 1.9% reading for August. Revolving credit grew 6.0% in June and 2.5% in July before turning negative in August. Second-quarter and earlier figures are marked revised in the release, and the August figures are preliminary.
How to read these numbers
Preliminary and revised figures
The Fed labels recent months preliminary (“p”) and revised (“r”), and later releases can change them. When you compare months, compare the same type of figure, and be careful about drawing a conclusion from a single preliminary reading. The September G.19 is the next data point, and it will also revise the August figure.
What the release does not tell you
The G.19 measures outstanding credit and average rates at commercial banks. It does not show your approval odds, the rate you would be offered, or how fees will change your cost. It also covers a broad population, from borrowers with excellent credit to those with thin credit files, so averages sit above what well-qualified borrowers may see and below what higher-risk borrowers may pay.
| Period | Total | Revolving | Nonrevolving |
|---|---|---|---|
| Q1 2026 | 2.6 | 4.2 | 2.0 |
| Q2 2026 (revised) | 3.1 | 4.9 | 2.4 |
| June 2026 (revised) | 3.6 | 6.0 | 2.7 |
| July 2026 (revised) | 4.1 | 2.5 | 4.7 |
| August 2026 (preliminary) | 1.9 | -4.2 | 4.1 |
Credit card rates: what the Federal Reserve data shows
Average card APRs at commercial banks
Accounts assessed interest
The G.19 reports two card measures. The first covers accounts assessed interest, meaning accounts that actually carried a balance and paid finance charges. That rate was 21.52% in the first quarter of 2026, 22.15% in the second quarter (revised), and 22.36% in August (preliminary). The August reading is 0.21 percentage points above the second quarter and 0.84 points above the first quarter.
This is the measure most relevant if you carry a balance, because it reflects the rate people are paying rather than the rate printed in an advertisement.
All accounts
The second measure covers all card accounts, including those that pay in full each month and therefore pay no interest. It was 21.00% in the first quarter, 20.94% in the second (revised) and 21.19% in August (preliminary). The figure is lower than the assessed-interest measure because it blends accounts at different rates and promotional terms. A 0% introductory offer pulls an account’s rate down in this average, but only while the promotion lasts.
Why card rates move with policy
The prime-rate link
A variable-rate card typically sets its APR as an index plus a margin, and the index is often the prime rate. With the prime rate at 7.00% in the October 21 H.15 release, an APR of 22.36% corresponds to a margin of about 15 points over prime if the account were priced that way, though real accounts vary and many have different margins. Treat that as arithmetic, not a description of any particular card.
The point for you is how a change in the index passes through. A quarter-point rise in the prime rate would raise the APR on a variable account by roughly a quarter point, subject to the terms of your agreement.
What a rate change costs on a balance
Consider a hypothetical $5,000 card balance carried for a full year. A 0.25 percentage point increase in the APR adds about $12.50 in interest over that year, and a 0.75 point increase adds about $37.50. These sums are small compared with the gap between a card rate above 20% and a personal loan rate near 12%, which is why the level of your rate, not small policy changes, usually dominates the cost.
| Category | Q1 2026 | Q2 2026 (revised) | Aug. 2026 (preliminary) |
|---|---|---|---|
| 24-month personal loans | 11.36 | 11.86 | 11.90 |
| Credit cards, all accounts | 21.00 | 20.94 | 21.19 |
| Credit cards, accounts assessed interest | 21.52 | 22.15 | 22.36 |
Promotions and fees hidden inside the averages
How a promotional rate changes your own number
Both card averages blend many kinds of accounts. A 0% introductory offer can sit beside a standard APR above 20% in the same average, so the headline number says little about any one account. The CFPB says an introductory rate on a new card or balance transfer must last at least six months, and that a payment more than 60 days late can end it early. The issuer must also disclose how long the rate lasts and what rate applies afterward.
When you see a promotion, write down the end date and the rate that follows. The post-promotion rate is the number the G.19 average is closest to.
Fees that sit outside the rate
Annual fees, balance transfer fees and late fees do not show up in an APR average the way a stated rate does. On the loan side, an origination fee raises the APR above the stated interest rate, which is why the CFPB advises comparing APR to APR. If you are comparing a card with a loan, add the fees to the interest, and compare total dollars repaid over the same period. A lower rate with a large fee can cost more than a slightly higher rate with none.
Worked examples using the October 2026 averages
Consolidating a larger card balance
The card path
Suppose, hypothetically, a borrower carries $8,000 on a card at 22.36%, the G.19 August average for accounts assessed interest, and pays $250 a month with no new charges. We computed a month-by-month schedule: the balance takes about 50 months to clear and costs roughly $4,282 in interest. Real cards compute interest daily and change minimum payments as balances fall, so the figures are approximate.
The point of the example is the shape of the cost. A payment that feels manageable can still take more than four years to retire a balance when the rate is above 20%.
The personal loan path
Now suppose the same borrower takes a hypothetical 36-month personal loan at 11.90%, the G.19 August average for 24-month loans, used here only as a stand-in rate. With no fee, the payment is about $265.33 and total interest is about $1,552. If the lender instead charged a hypothetical 5% origination fee and the borrower financed it to receive the full $8,000, the loan amount would be about $8,421, the payment about $279.30, and the total cost about $2,055 including the fee. Origination fees vary by lender and some lenders charge none.
Even with a fee, the cost in this example is well under the card path, but only if the borrower stops adding to the card. The side-by-side comparison of a 0% APR card and a personal loan explains how a promotional card changes the answer.
A smaller balance and a rate change
Paying down faster
For a hypothetical $2,000 balance at 22.36%, paying $100 a month takes about 26 months and roughly $526 in interest. Paying $200 a month takes about 12 months and roughly $234. Doubling the payment cuts the time by more than half and the interest by more than half. When a balance is small, a faster payoff often matters more than a rate change.
If a variable rate rises
Take a hypothetical $6,000 balance paid over 24 months. At 22.36% the payment is about $312.34 and interest about $1,496. If the rate were 0.25 points higher, interest would rise to about $1,514, an extra $18. If it were 0.75 points higher, interest would be about $1,550, an extra $54. These assume a constant rate across the term, which a variable-rate card may not have.
This is why a modest policy move changes your cost much less than the gap between a card and a lower-rate alternative, and why the level of your starting rate deserves most of your attention.
| Example (hypothetical) | Payment path | Approx. time | Approx. interest |
|---|---|---|---|
| $8,000 on a card at 22.36% | $250 a month | About 50 months | $4,282 |
| $8,000 loan at 11.90%, 36 months, no fee | About $265 a month | 36 months | $1,552 |
| $8,000 loan at 11.90%, 36 months, 5% fee financed | About $279 a month | 36 months | $2,055 including fee |
| $2,000 on a card at 22.36% | $100 vs. $200 a month | 26 vs. 12 months | $526 vs. $234 |
Personal loan rates: what the data shows
The 24-month personal loan rate
The trend in the G.19
The G.19 average rate on 24-month personal loans at commercial banks was 11.36% in the first quarter of 2026, 11.86% in the second quarter (revised) and 11.90% in August (preliminary). That is a rise of 0.54 percentage points over the span, and a small change between the second quarter and August. The release does not publish this rate for June or July.
Because the personal loan figure covers a specific term at commercial banks, it should not be generalized to every lender, term or loan size.
Averages are not offers
An average is not a quote. Your offer depends on your credit profile, income, requested amount, term and the lender’s own pricing, and the range around any average is wide. Some lenders charge an origination fee, a one-time fee deducted from the proceeds or added to the balance. The CFPB explains that APR includes certain lender fees, so compare APR to APR rather than comparing a stated interest rate to an APR. Rate shopping for a personal loan explains how to compare offers without piling up hard pulls.
The gap between cards and loans
A hypothetical $5,000 comparison
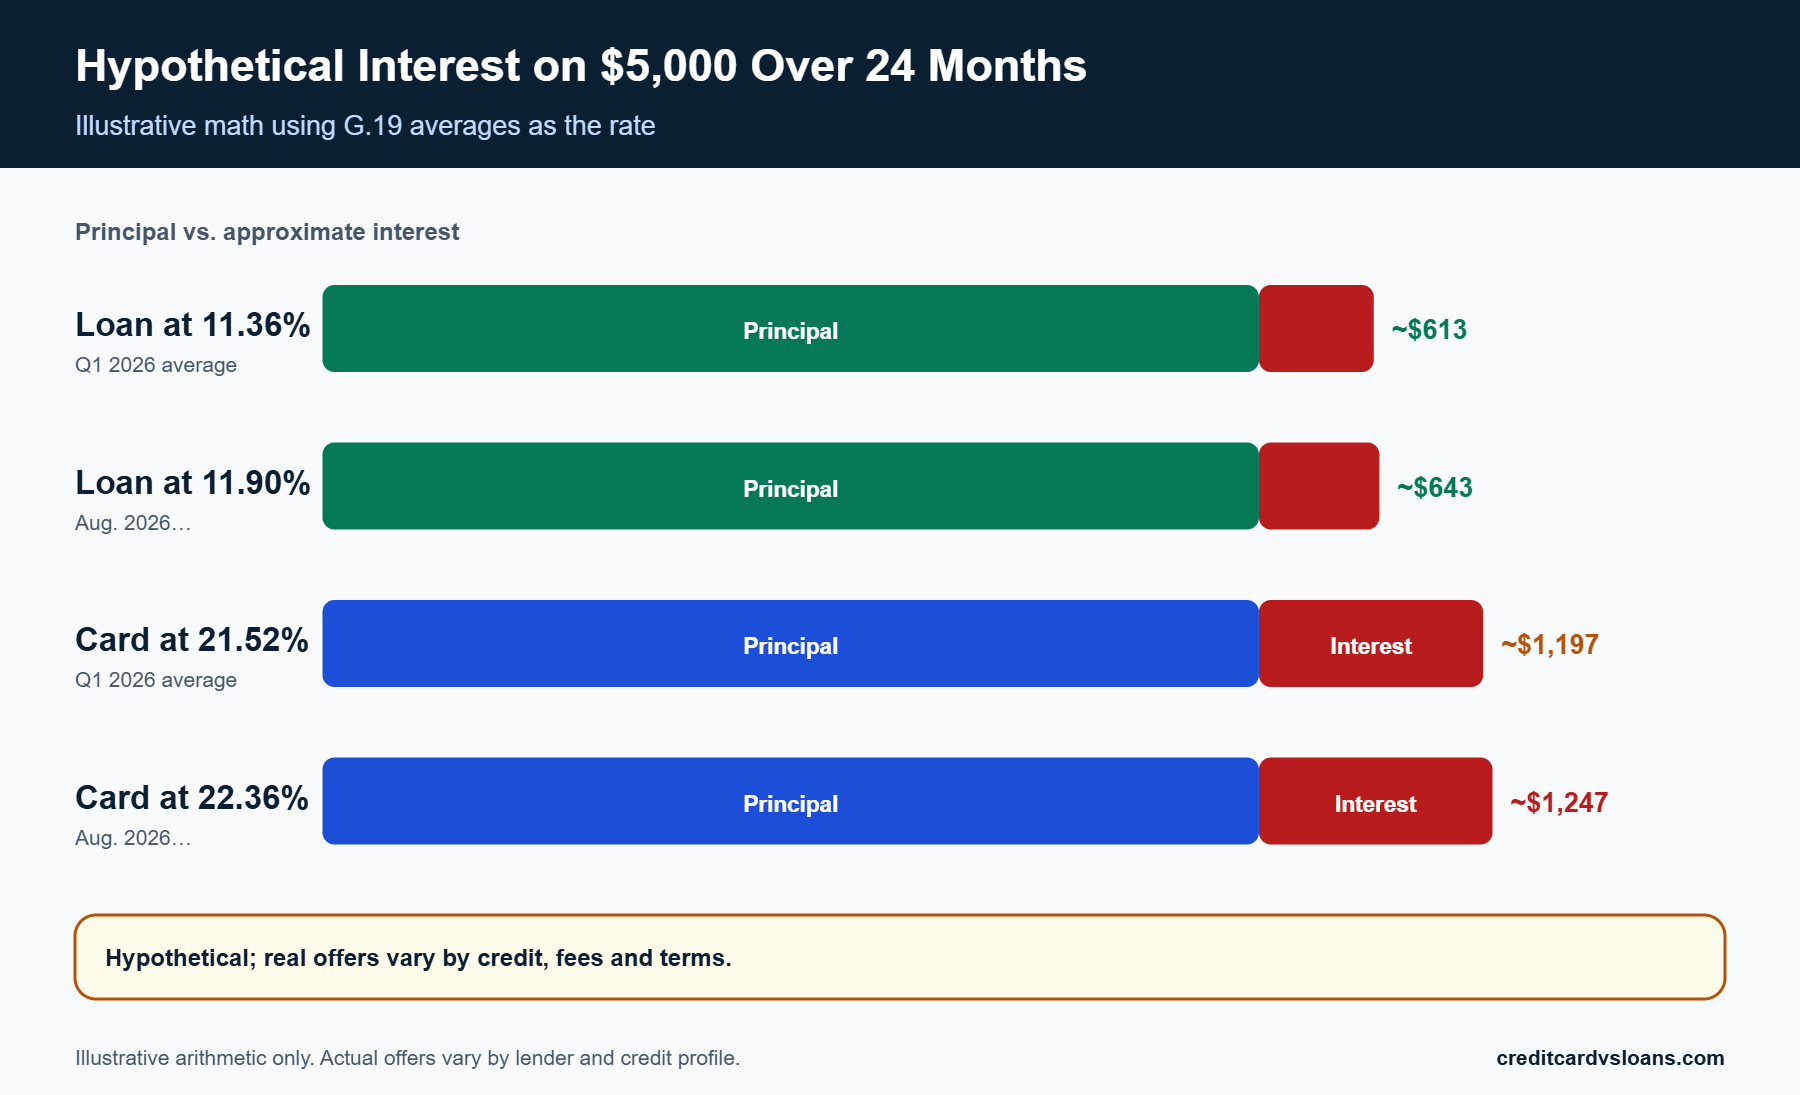
Hypothetically, a $5,000 balance repaid over 24 months at 11.90% would carry a monthly payment of about $235.13 and total interest of about $643. The same balance repaid over 24 months at 22.36% would carry a payment of about $260.28 and total interest of about $1,247. If the borrower on the card instead kept paying $235.13 a month, it would take about 28 months and about $1,427 in interest.
These are illustrative calculations that use the G.19 averages as inputs. They are not offers, and fees or promotional terms would change the result.
When the gap narrows
The gap shrinks or reverses in some situations: a 0% promotional card that you can repay inside the promotion, a personal loan with a high origination fee, or a borrower whose loan offer is priced well above average. The cost comparison of a 0% APR card and a personal loan covers those cases, and the furniture financing example shows the same logic applied to a specific purchase.
| Scenario (hypothetical) | Rate used | Monthly payment | Approx. total interest |
|---|---|---|---|
| Personal loan, Q1 2026 average | 11.36% | $233.88 | $613 |
| Personal loan, Aug. 2026 average | 11.90% | $235.13 | $643 |
| Card, Q1 2026 average (assessed interest) | 21.52% | $258.21 | $1,197 |
| Card, Aug. 2026 average (assessed interest) | 22.36% | $260.28 | $1,247 |
What these numbers mean for common decisions
If you carry a card balance
The cost of waiting
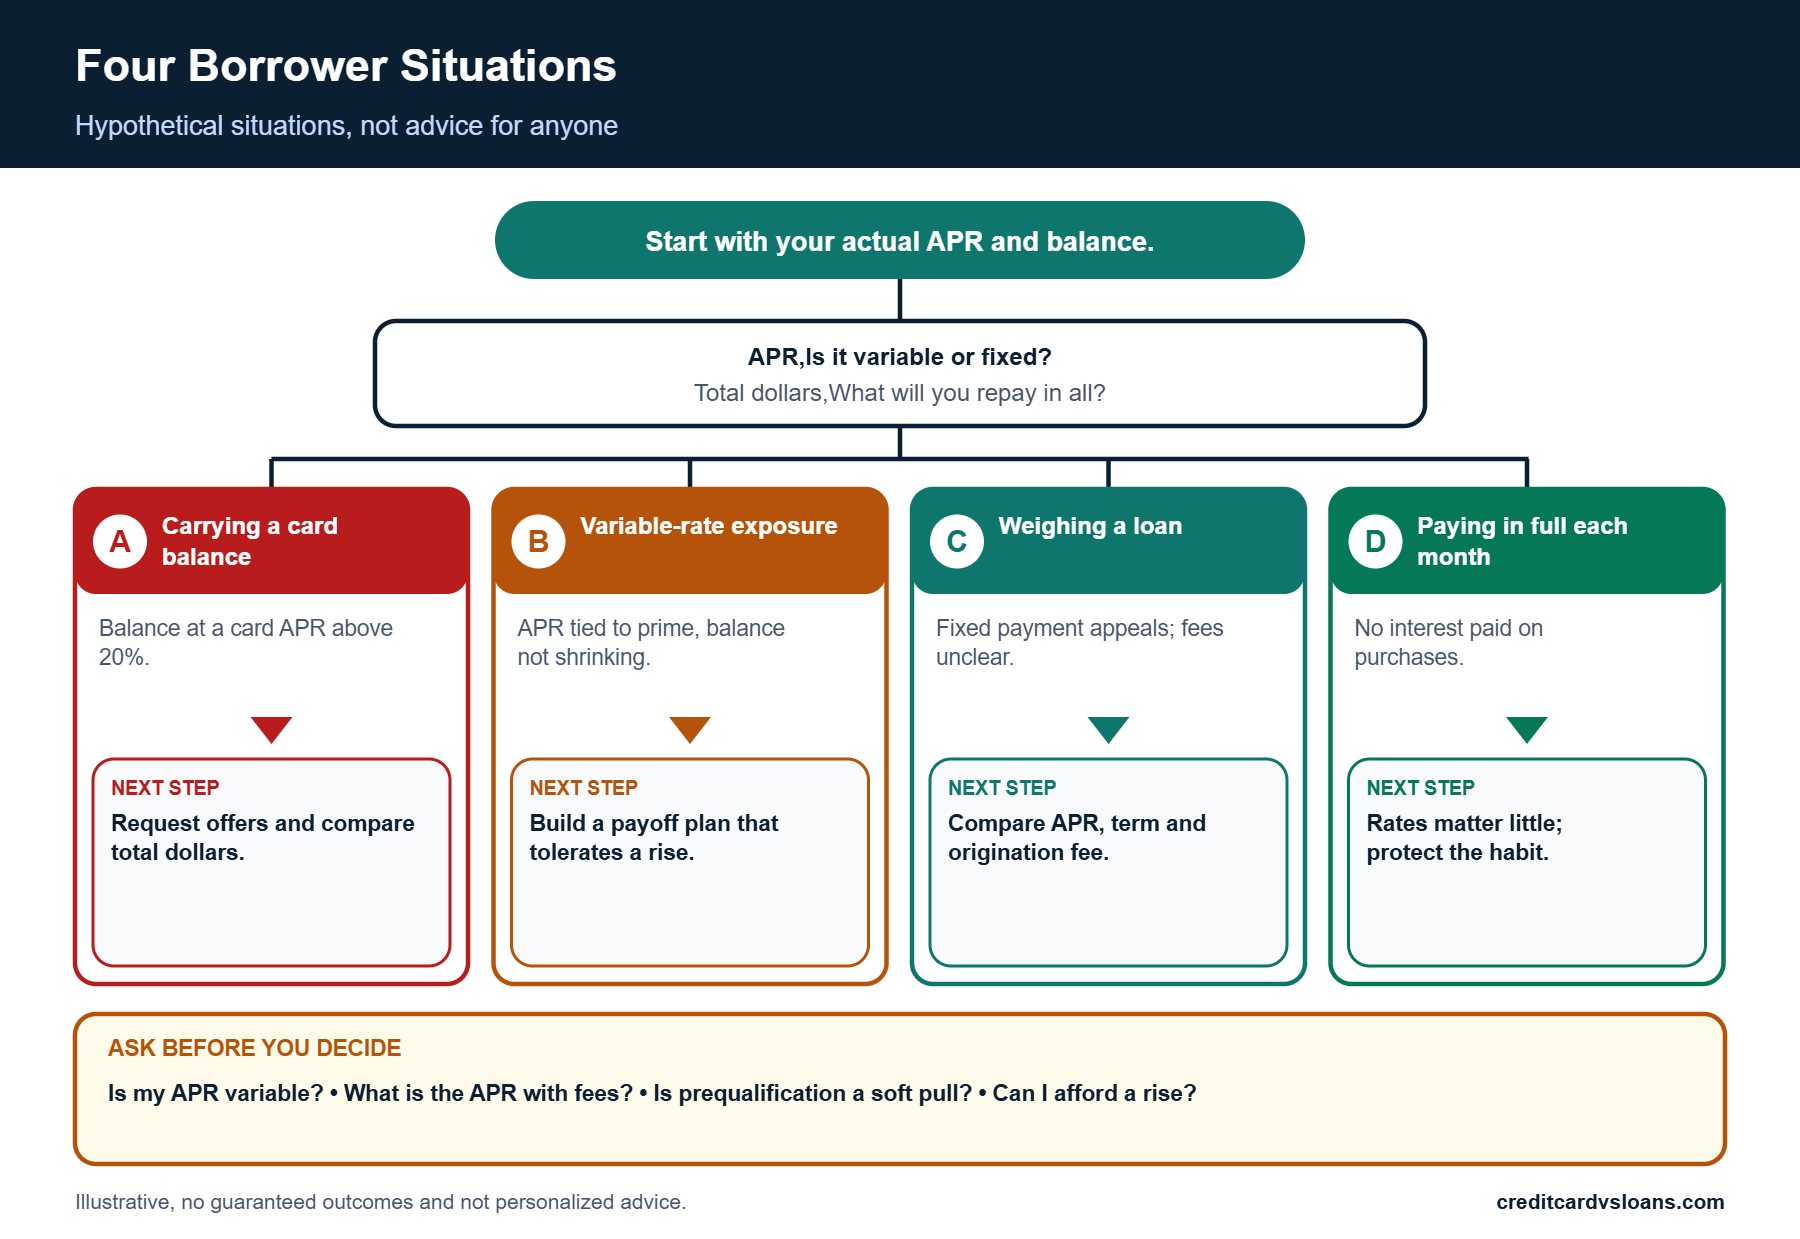
Every month at a card rate above 20% adds interest to a balance that a lower-rate product might carry more cheaply. If you qualify for a lower rate through a personal loan or a promotional offer, the savings depend on fees, the term and whether you stop adding new charges. The comparison needs your own numbers, so request actual offers rather than relying on averages.
Do not stretch a payoff to lower the monthly payment without checking the total cost. A longer term lowers the payment and raises the total interest.
Ways to cut the rate without new debt
You can ask your issuer whether a lower rate or a hardship program is available, though the answer varies and nothing is assured. You can also move future charges to a card you pay in full each month, or build a payoff plan around the highest-rate balance first. A nonprofit credit counselor can review the whole picture at low or no cost, depending on the agency.
If you are considering a personal loan
Compare the full cost
Compare the APR, term, monthly payment, any origination fee, prepayment terms and total dollars repaid. Check whether the lender uses a soft pull for prequalification, and keep applications inside a short window if you do apply to several. Confirm the lender’s name and licensing, and read the loan agreement before you sign.
Fixed rate and predictability
A fixed-rate personal loan keeps the payment the same across the term, which can make budgeting easier than a variable-rate card balance. The trade-off is that the loan has a set payment you must make, and an origination fee reduces what you receive. Business loan requirements explain what a business borrower should prepare, if the money is for a business rather than for personal expenses.
What to watch next: dates, releases and what has not happened yet
The calendar for the next six weeks
The October FOMC meeting
The Federal Reserve’s 2026 calendar lists the next FOMC meeting for October 27 and 28. As of October 22, 2026, no statement from that meeting exists, so this brief makes no claim about the outcome. If you read this after the meeting, check the Fed’s press release page for the statement, and compare the new target range with the 3¾% to 4% range set in September. The meeting after that is scheduled for December 8 and 9, and it is a meeting that includes a Summary of Economic Projections.
The next G.19 and daily H.15 updates
The G.19 is generally issued on the fifth business day of each month. Counting business days from the start of November 2026 puts the September data release on Friday, November 6, but you should confirm that date on the Fed’s release calendar. That release will update the August figures and give the first reading for September. The H.15 is posted Monday through Friday at 4:15 p.m., so you can check the federal funds and prime rates yourself at any time.
| Item | When | Why it matters to a borrower |
|---|---|---|
| FOMC meeting | October 27 to 28, 2026 | Any change in the target range can pass through to variable-rate cards. |
| H.15 daily rates | Weekdays, 4:15 p.m. | Shows the effective fed funds rate and the prime rate. |
| G.19 for September | Generally the fifth business day of November | Updates card and loan balances; rates update on the quarterly schedule. |
| FOMC meeting | December 8 to 9, 2026 | Includes a Summary of Economic Projections. |
Signals that matter for your own borrowing
Your card agreement and notices
The data above matters less than what your own issuer does. Check whether your APR is variable, which index it uses, and how and when changes take effect. Read any notice of a change in terms. If you are carrying a balance, ask your issuer for the current APR on the statement, and compare it with the G.19 averages to see whether your rate sits above or below them.
Your own credit profile
Your offer depends on your credit history, income and existing debt much more than on a monthly average. Check your reports before you apply, correct any errors, and pay down revolving balances where possible. Free personal credit reports are available at AnnualCreditReport.com. Pausing new applications for a while can limit hard pulls if you plan to shop for a loan.
Limits of a rate brief
What averages cannot say
Averages hide a wide range
The G.19 averages blend borrowers with very different credit profiles and cards with very different terms. A borrower with strong credit and a prime-based card may pay far less than the average, and a borrower with limited credit may pay far more. The averages are a yardstick for how the market is moving and how a given offer compares, not a prediction of your rate.
Lagging and revised data
The rate measures are published on a quarterly basis in the G.19, and recent months are preliminary. Policy changes in September may not yet be fully reflected in the card and loan averages published in October. That timing is one reason this brief points to what to watch rather than to a forecast.
What this brief will not do
No forecast of the next move
We do not predict whether the Fed will raise, lower or hold rates at the October meeting. Past rate changes and one quarter’s data cannot settle that, and a forecast presented as fact would do you a disservice. Plan around a range of outcomes: a payment you can afford if a variable rate rises, and a payoff plan that does not rely on rates falling.
No personalized recommendation
Nothing here tells you which product to pick. It gives you the latest benchmarks, a method for comparing offers and a list of dates. For personal guidance, a nonprofit credit counselor or a licensed financial professional can look at your whole situation.
Questions about timing
Should I wait for the October decision?
Waiting makes sense only if you can afford the wait. If you are carrying a balance at a high rate, each month of delay costs interest, and a one-quarter-point move is small next to the gap between a card and a lower-cost option. If your decision depends on a fixed-rate offer, the lender’s pricing already reflects its view of rates, and you can ask how long an offer is good for. A quote that expires in a few days can leave little room to wait.
Does a rate hike change my fixed-rate loan?
A fixed-rate loan keeps its rate for the term, so a later policy change does not change the rate on a loan you have already signed. Future offers may be priced differently. Variable-rate products, including many cards, follow the terms in the agreement, which usually tie changes to an index and require notice. Read the notice you get from your issuer, and ask for the effective date of any change.
Common questions about this brief
Reading the Fed figures
What is the difference between the two card rates?
The G.19 card rate for all accounts includes accounts that pay in full and so owe no interest. The rate for accounts assessed interest covers only accounts that were charged interest. If you carry a balance, the second figure is closer to your situation. If you pay in full every month, the first is the broader market reading and your own interest cost is zero on purchases.
Why does the G.19 not list June and July rates?
The release marks interest rates as not available for June and July 2026 and gives figures for the quarter and for August. Treat the interest rate data as a periodic reading instead of a monthly line, and compare the same periods when you look at changes. Check the table notes in each release.
Using the numbers
Can I use these averages to judge my offer?
You can use them as a rough yardstick, with care. If your quoted card or loan APR is far above the relevant average, ask why, and request alternative offers. If it is far below, the difference may reflect strong credit or a promotional term. The rate you get depends on your profile, and an average cannot tell you whether your offer is fair on its own.
What data should I trust for decisions?
Use primary sources for market data: the Federal Reserve for G.19, H.15 and FOMC statements, and the CFPB for consumer protections and borrowing guidance. For your own offer, rely on the lender’s written disclosure of the APR, fees, term and payment. Compare disclosures from more than one lender before you decide.
Cards, loans and your credit
Hard pulls and rate shopping
Applying for a loan or card can trigger a hard pull, a credit check that may appear on your report and can affect a score for a time. Prequalification tools that use a soft pull let you see estimated terms without that effect, though the final offer can differ. If you plan to compare several lenders, doing it within a short window and using prequalification where it is offered can limit the effect. The rate shopping guide covers the details.
Utilization and payoff
The CFPB lists how much of your available credit you use among the common factors in a credit score. Paying down a card balance can lower utilization, and a personal loan that pays off cards can change the mix of your accounts. The effect on your own score depends on your whole file, so do not assume a specific change. Avoid running balances back up after a payoff, because that can undo the benefit and leave you with both a loan and a card balance.
Decision checklist and next steps
What the October data suggests
The cost gap is large and persistent
The latest G.19 shows a card rate near 22% for balances carried and a 24-month personal loan rate near 12%. That gap has existed in each of the periods the release shows. It does not mean a loan is right for everyone, but it does mean that a carried card balance deserves a cost check.
The September rate increase adds a reason to look at variable-rate exposure. If your card APR is variable, your payment cost could move with the next policy decision, and a payoff plan that is robust to that is safer.
As of October 22, 2026, the federal funds target range is 3¾% to 4%, the prime rate is 7.00%, and the Fed’s latest data show card rates over 22% and 24-month personal loan rates near 12%. The September G.19 and the October FOMC decision are still to come, so check them when they arrive.
What to do before you borrow
Collect actual offers, compare APR and total dollars, and test the payment against a slow month. If your goal is to consolidate card balances, compare a personal loan, a balance transfer and a payoff plan on the same terms. If you are a business owner, lender requirements for business loans explain what to prepare.
What would change the picture
Several developments could change what the next brief says, and none of them is known today. The October FOMC decision could leave the target range at 3¾% to 4% or move it. The September G.19 could revise August’s soft revolving credit reading in either direction. The quarterly rate series could show card and loan averages moving further apart or closer together. Because we cannot know which will occur, the most useful preparation is a plan that works under more than one outcome: a payment you can afford if your variable rate rises, and an exit from high-rate debt that does not depend on a hoped-for drop in rates.
Write that plan down now, while you are not reacting to a headline. A written plan is easier to follow on the day the statement is released.
How to compare this brief with the next one
Keep the same yardsticks
When the November brief arrives, compare the same measures: the target range, the effective federal funds rate, the prime rate, the August and September consumer credit changes, and the card and personal loan rates. If a figure has been revised, compare the revised value with the new one so you are not measuring a revision as if it were a market move. Keep a simple note with the date and source of each number, and update it as new releases arrive.
Separate the market from your own file
A market average can rise while your offer falls, or the reverse, because your credit profile and the lender’s pricing are separate from the average. Track your own APR and balance alongside the market numbers, and review your credit reports each year. If your profile has improved since you last applied, an offer that looked out of reach may now be worth requesting. If it has weakened, focus on repair before you shop.
A short action list
This week
- Find the APR and index on each card you carry, and note which are variable.
- Write down your balances, rates, minimum payments and the date each promotion ends, if any.
- Check your credit reports for errors at AnnualCreditReport.com.
- Mark the FOMC meeting on October 27 and 28, and the November G.19 date on your calendar.
- Request prequalified offers that use a soft pull before you apply.
After the next data arrives
- Read the Fed’s October statement and compare the new range to 3¾% to 4%.
- Check the H.15 prime rate to see whether card APRs may adjust.
- Review the September G.19 for changes in revolving credit and rates.
- Revisit your plan: if rates rose, shorten the payoff or move high-rate balances; if they held, keep the plan steady. Read last month’s brief for the earlier baseline.
- Credit Card and Personal Loan Rate Outlook: September 2026 Borrower Brief
- 0% APR Credit Card vs. Personal Loan: Which Is Cheaper?
- Business Loan Requirements: Revenue, Time in Business and Credit
- 0% APR Credit Card vs. Personal Loan for Furniture: Which Wins?
- Does Rate Shopping for a Personal Loan Hurt Your Credit?
- Federal Reserve: G.19 Consumer Credit (release of October 7, 2026)
- Federal Reserve: H.15 Selected Interest Rates (release of October 21, 2026)
- Federal Reserve: Federal Reserve issues FOMC statement, September 16, 2026
- Federal Reserve: FOMC meeting calendars and information
- CFPB: How long can I keep a low rate on a balance transfer or other introductory rate?
- CFPB: What is the difference between a loan interest rate and the APR?
Last updated: October 22, 2026. Rates, fees and lender rules change; verify current terms before acting.
The information on creditcardvsloans.com is provided for general educational and informational purposes only. It is not financial, legal, tax, credit, accounting or investment advice, and reading it does not create an advisor-client, fiduciary or any other professional relationship. Nothing here is an offer, solicitation or recommendation to borrow, lend or apply for any product.
Credit scores, interest rates, fees, eligibility rules, lender policies and laws change frequently and vary by lender, location and individual circumstances. Examples, figures and scenarios are illustrative only, do not predict your results and do not guarantee approval, savings, a particular rate or a credit-score outcome. Always confirm current terms directly with the lender or issuer and read the full agreement before you apply or sign.
Although we aim for accuracy and use reputable sources, we make no representations or warranties, express or implied, about the completeness, accuracy, reliability or timeliness of the content. Content may be drafted with the assistance of automated tools, so errors or omissions may still occur. Links to third-party sites are provided for convenience; we don’t control and aren’t responsible for their content.
To the fullest extent permitted by law, creditcardvsloans.com and its owners, editors, authors, contributors and affiliates disclaim all liability for any loss, damage or expense arising directly or indirectly from your use of, or reliance on, this content. Before making financial decisions, consult a licensed professional, such as a qualified financial advisor, attorney, tax professional or nonprofit credit counselor, who can consider your complete situation.